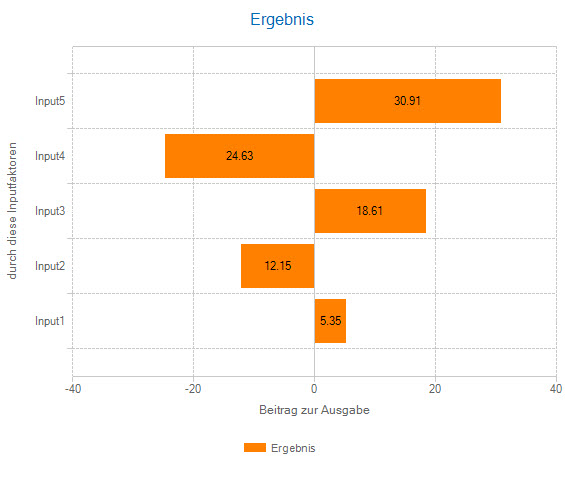
Risk management must be efficient and is forced to make effective decisions with scarce resources. Being able to find the problematic risk drivers and set well-founded priorities for management is therefore an important strategic goal of a risk analysis.
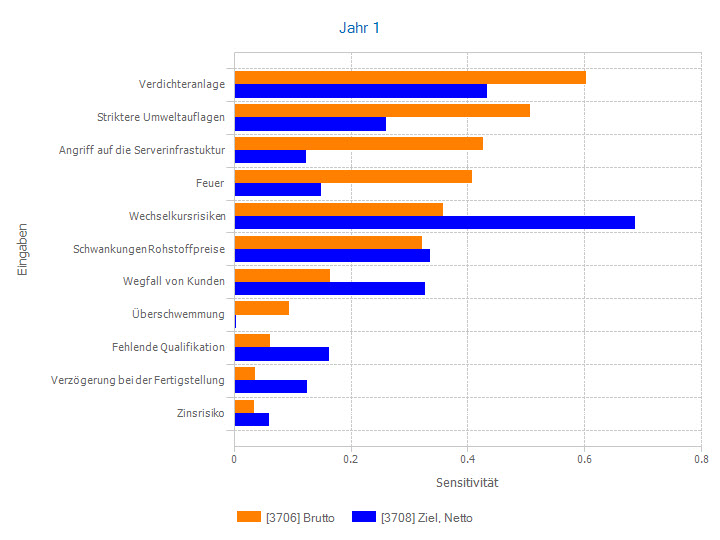
Risk Kit and the Enterprise Risk Evaluator provide methods for evaluating sensitivities, that is, the effect of risk factors on the result. They answer a wide range of possible guiding questions:
- Which risk factors have the strongest effect on the result? What are my top risks?
- How large is the absolute effect of a risk factor on the result, in the unit of the result?
- How do risk events affect the result when they occur?
- Can I tell whether a risk-mitigating measure is ineffective or only weakly effective?
- How are the contributions to the overall risk distributed across the individual risk factors?
- How can I communicate the results in a table and as a chart?
Here is an overview.
Absolute Sensitivities
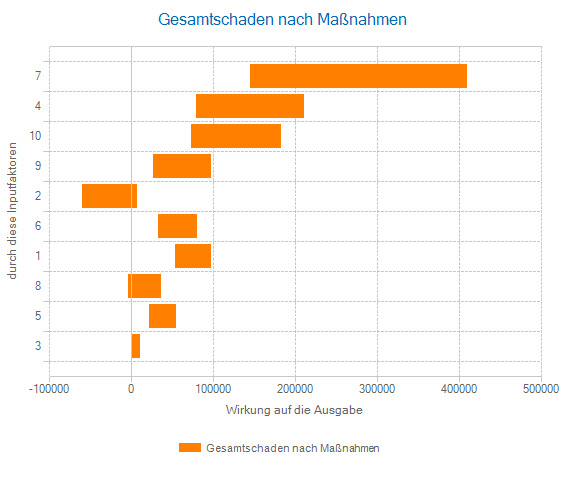
Absolute sensitivities capture the effect of a risk factor on the result in the unit of the result. All risk factors therefore share a uniform "currency" and are comparable with one another. They are calculated by computing the mean or median of the result for a quantile range of the risk factor (for example 0-10%, 10-20%, and so on).
The spider chart and the tornado diagram illustrate these steps. They are a proven means of risk communication.
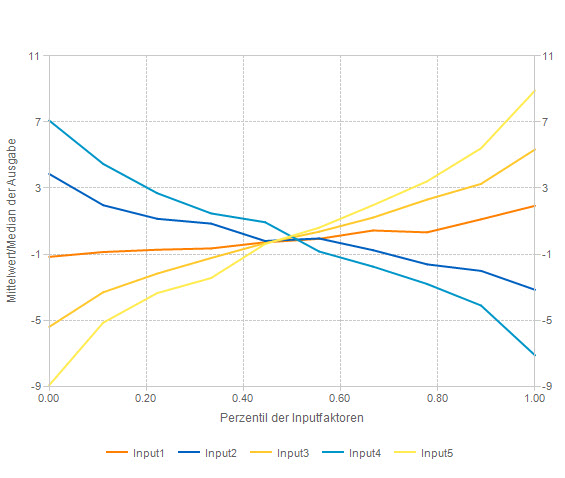
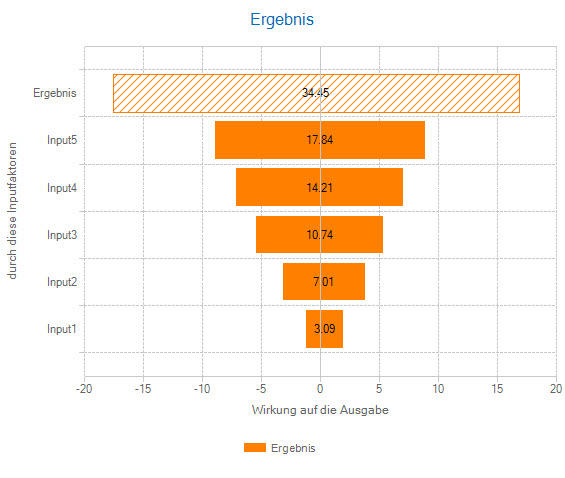
In enterprise risk management, this sensitivity type is particularly interesting, because if a risk is not mitigated by measures, its effect on the result often does not change. The sensitivity of this unmanaged risk then also remains stable. This is an important prerequisite for being able to identify measures that do not reduce the impact of the risk factor on the result.
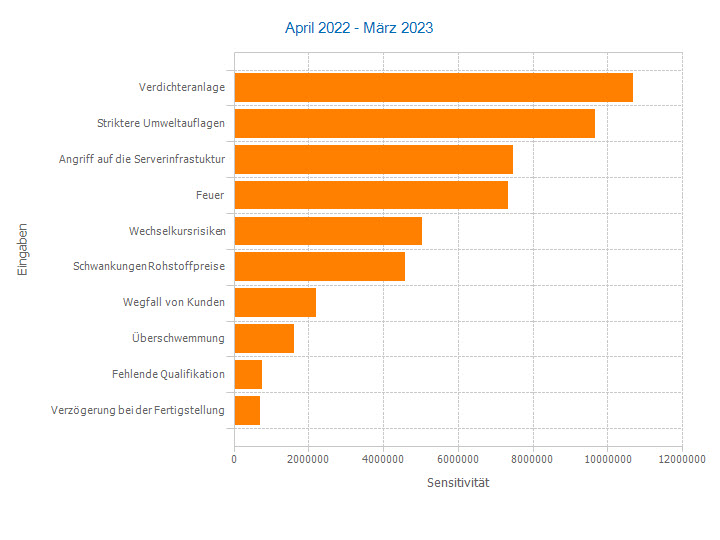
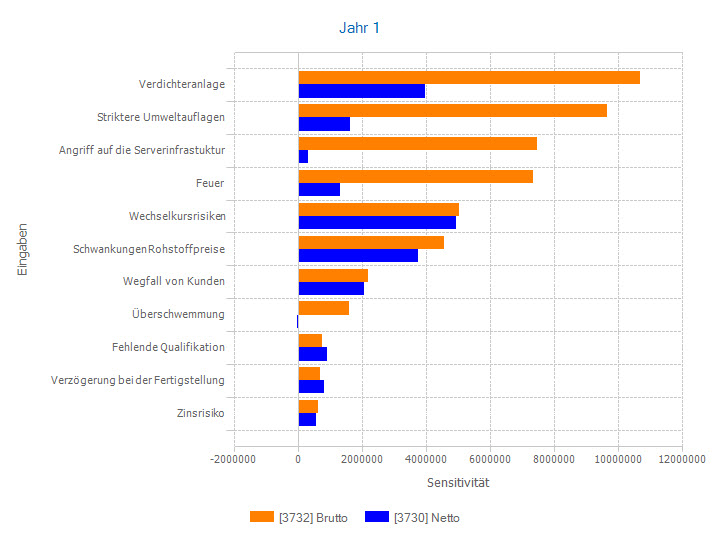
For event-driven risk factors that do not always occur but only sometimes, or that take on only a few values, there is a special sensitivity type: conditional absolute sensitivities. Here, all results for which the risk factor has the same value are condensed into a single number using their mean or median. The absolute sensitivities are then calculated only across the different values of the risk factor.
The advantage of conditional absolute sensitivities is that the case in which the risk did not occur at all, or has a fixed value and accordingly has no differing effect, is removed from the analysis. The focus then shifts to the question, "within what range does the result change when the risk factor changes?" This makes visible factors that do bring uncertainty into the system, but that are also, or even primarily, opportunities rather than risks.
Relative Sensitivities: Correlations and Covariances
Relative sensitivity concepts put quantities in relation to one another. They therefore generally have no unit and move within a certain value range.
Important relative sensitivities are linear correlations, rank correlations, contributions to variance (squared rank correlations whose sum is standardized to 1), and beta factors. Their absolute value indicates how closely the risk factor and the result are related. Their sign indicates the direction of the relationship.
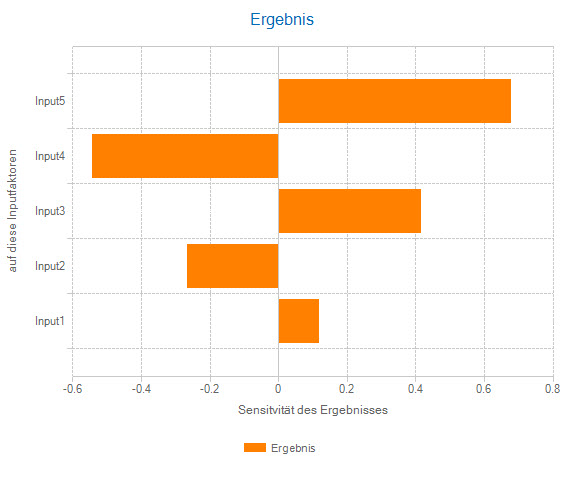
When measures are taken, a peculiar effect follows: the relative sensitivities of risk factors that have no measures of their own also change. They generally become larger, because their contribution to what is, so to speak, a smaller pie after the measures are applied now appears relatively larger.
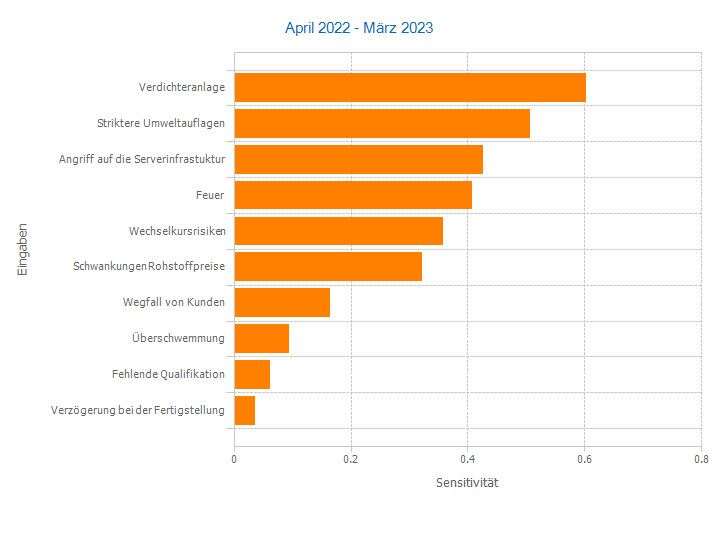
Correlations take values between -1 and 1. Contributions to variance cannot become negative. Their values lie between 0 and 1.
Beta factors are not bounded in their value range but usually lie between -3 and 3. If their absolute value is greater than 1, this means that the covariance between the factor and the result is, in absolute terms, greater than the variance of the result.
If the risk factor is very widely dispersed, caution is warranted, because this can lead to a spurious random relationship being detected. Using the beta factor is therefore particularly advisable when there is a known structural relationship between a risk factor and the result, for example between a stock price and a stock index that includes the stock itself.
Contributions to Risk
Risks cause costs, including through risk management itself. In addition, there are capital costs for the risk capital backing that has recently been required in the risk-bearing capacity assessment under IDW PS 340. Allocating these costs back to the risks is therefore a natural application of the cost-causation principle.
To determine the risk contributions, you additionally specify the risk measure to be allocated back to the risks. This can be a Value at Risk (quantile) as well as an Expected Shortfall. The absolute sensitivities or beta factors take on the sign of the linear relationship between the risk factor and the result and are scaled so that they sum to this risk measure.