
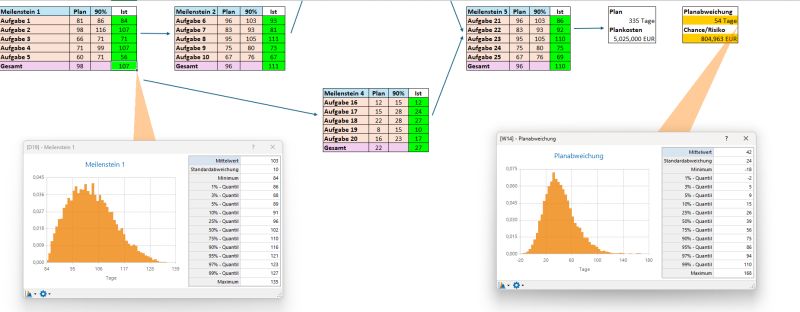
𝗪𝗵𝗮𝘁 𝗶𝗳 𝘆𝗼𝘂 𝗰𝗼𝘂𝗹𝗱 𝗲𝘅𝗽𝗹𝗮𝗶𝗻 𝘆𝗼𝘂𝗿 𝗿𝗶𝘀𝗸 𝗺𝗼𝗱𝗲𝗹𝘀 𝗰𝗹𝗲𝗮𝗿𝗹𝘆 𝗮𝗻𝗱 𝘂𝗻𝗱𝗲𝗿𝘀𝘁𝗮𝗻𝗱𝗮𝗯𝗹𝘆? Risk models take numerous risk drivers into account and produce differentiated results for one or more target metrics. But how do you communicate such a model internally in a way that meaningfully advances risk management? In practice, whatever cannot be explained often meets with skepticism, even if it is far more precise than the frequently misleading expert estimates. With today's #Halloween 𝗿𝗲𝗹𝗲𝗮𝘀𝗲 𝗼𝗳 𝘁𝗵𝗲 𝗻𝗲𝘄 𝗥𝗶𝘀𝗸 𝗞𝗶𝘁 𝟴.𝟮, transparency into every risk driver is just one click away. You can present each individual driver and result clearly and interactively. Simply point at a factor, and the distribution is rendered graphically and backed up with statistics. The visualization clearly shows what the risks look like and ensures unambiguous attribution. As soon as you move to the next step, the charts close again. Say goodbye to expert jargon and experience clarity in risk management. Risk Kit 8.2 delivers clarity, because your company deserves good risk management software. https://lnkd.in/e7RTdghN
This post was originally published on LinkedIn. View and join the discussion there